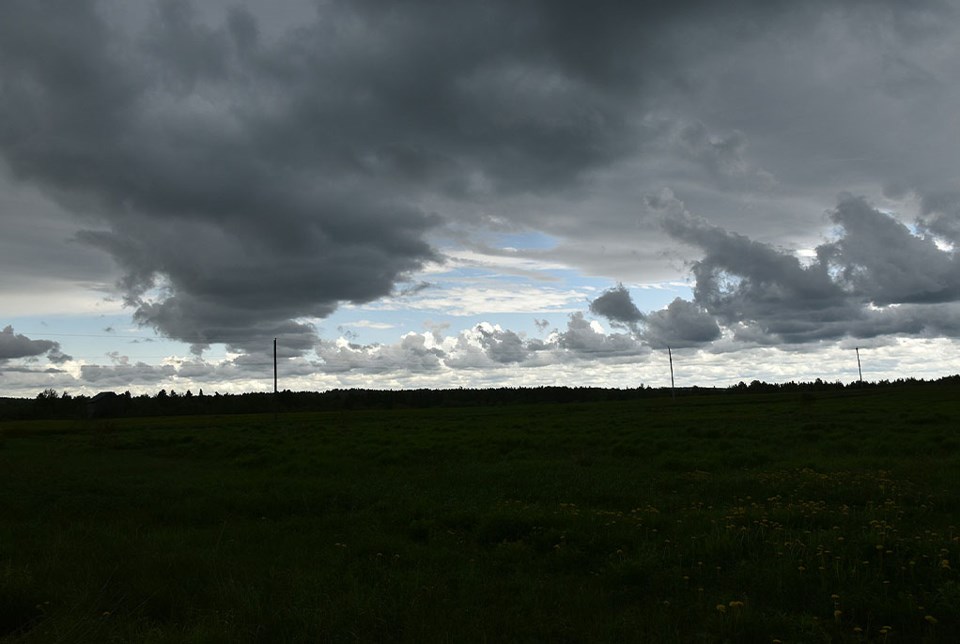
SASKATCHEWAN - June was a cool and wet month for most of Saskatchewan.
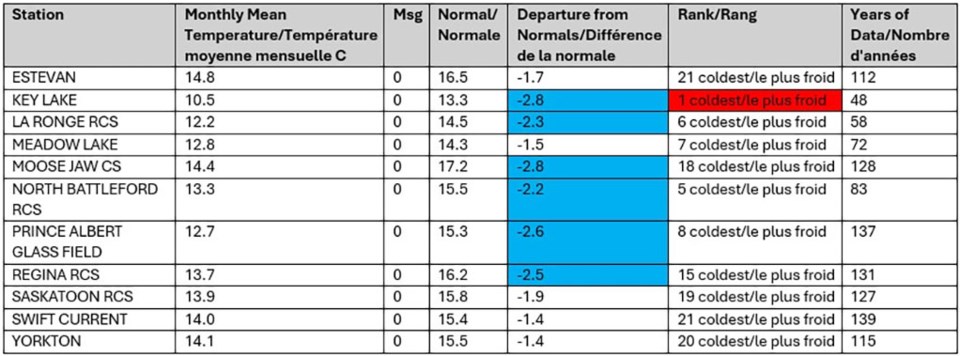
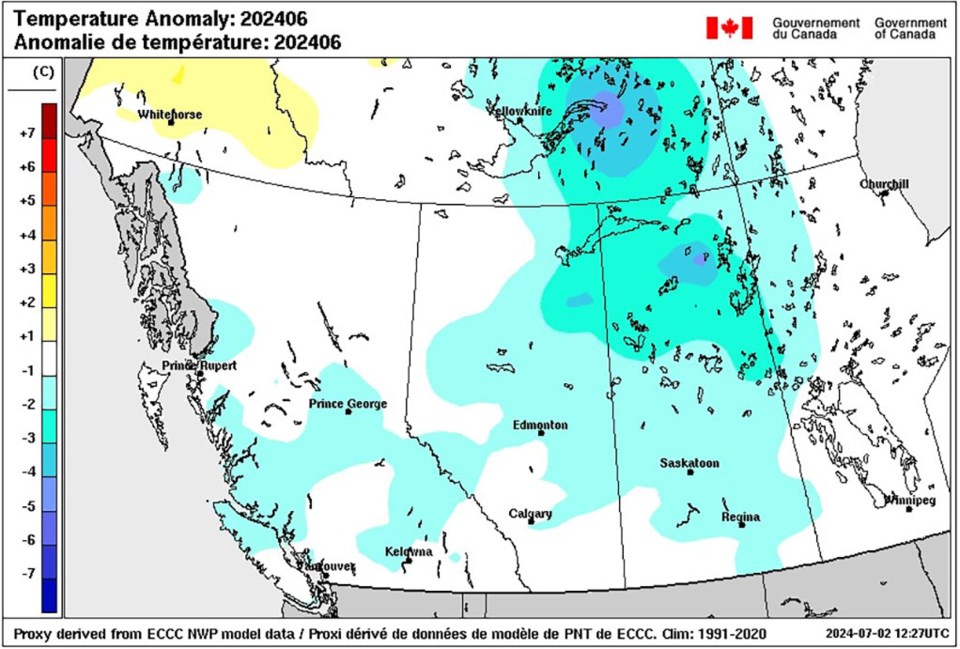
Environment Canada released last month’s weather statistics on Tuesday and Meteorologist Terri Lang says temperatures were cooler than normal the further north you went, going against what they initially forecast of a warmer than average month.
“Goes to show you that we don’t know everything,” Lang said.
Regina had an average temperature of 13.7 degrees, which is 2.5 degrees below normal; Yorkton recorded 14.1 degrees for the month, slightly below the average of 15.5 degrees. Key Lake had its coldest June ever at 10.5 degrees.


Lang admitted she hasn’t heard a clear reason why last month was chilly.
“Other than just the demise of El Nino and sort of that effect on the jet stream; at least letting the weather systems move through which could have cooled things off a little bit but … I’ve seen no big reason for it yet.” guessed Lang.
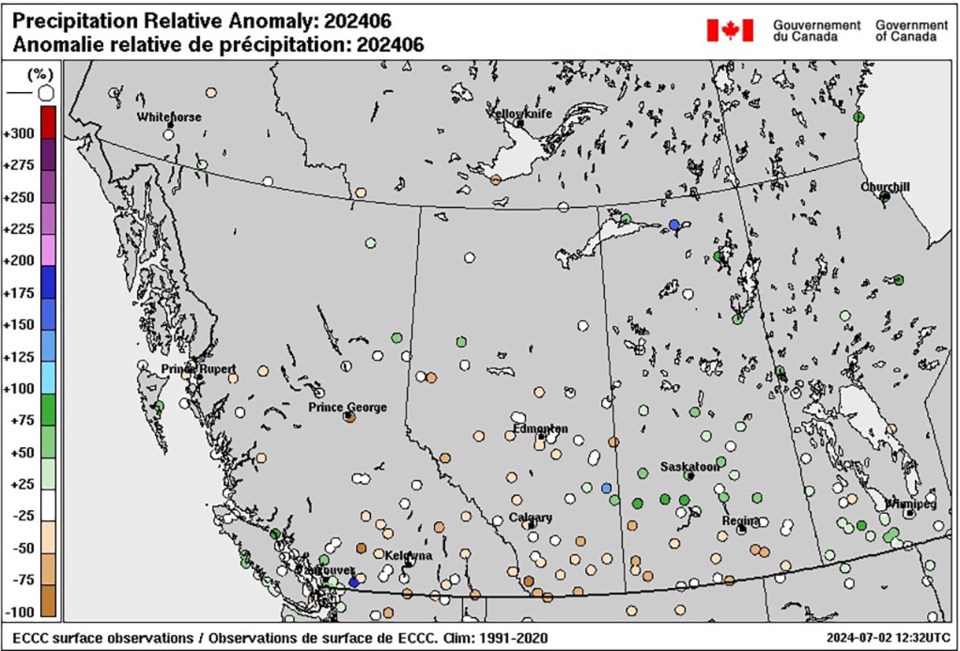
As for rain, everyone got it.
Meadow Lake, Prince Albert, Regina, Saskatoon, and Yorkton recorded more than 150 per cent of their average precipitation for June. Yorkton had the most at 121 mm, closely followed by Prince Albert at 120.7 mm, Saskatoon 112.2, Meadow Lake 108.7, and Regina 107.5. Moose Jaw and North Battleford were also above average for rain; Estevan, La Ronge, and Swift Current were slightly below average; and Key Lake was closer to normal.
Lang says an area northwest of Kindersley was likely soaked from last week’s weather system which brought a significant amount of rain.
“Probably got between 150 and 200 millimetres in probably twelve hours or so, so it really came down out there.”


